This is intended to be a summary report on the overall metrics of the weather in 2020. It is made more difficult by the BoM site being off air for several days (especially January 2020 due to bushfire related issues). I will endeavour to avoid too many graphs.
In summary:
- Rainfall: Above both mean and median.
- Temperatures
- Average: slightly above the long term mean;
- Maximum: close to long term mean
- Minimum: above long term mean
- Humidity: Difficult - see below - but probably balances out to slightly more humid in 2020 than 2019.
- Wind: Again difficult, but my data suggests slightly windier in 2019 than 2020.
Rain
At my Weather Station (WS) the year totaled 1007 mm effectively the same as the BoM station at the airport. This is 108% of the mean annual fall and 116% of tht median fall. In summary a nicely damp year!
There is no significant trend in the annual data series with the first several years being highly variable, followed by a more stable 20 years and more recently further variability.

- low falls until mid-February (except a downpour in late January);
- below average falls until July (except a dump in early June);
- a gradual increase through July and August;
- about average falls for the rest of the year, with the annual estimate bobbling around 1000 mm.

In 2020 more than 0.2 mm of rain was recorded on 134 days. This compares to 110 days in 2019 and an average (for years with complete data) since 1975 of 120 days.
Temperatures
Average Temperatures
There are two ways of calculating average temperatures.
- The more precise is to take the mean of temperatures taken at points in time through a period. I can do this with readings from my WS which gives an annual average temperature for 2020 of 15.76C.
- As I don't have readings for the first 6 weeks of 2019 a comparable value is not possible.)
- I cannot do this with BoM data since the series available though Climate Data on Line only include at the most detailed daily minima and maxima.
- A second method is to take the average of the maximum and minimum temperatures though a period. This can be done on a daily, monthly or annual basis. The result is usually very similar to the more precise value. Applying the method to BoM data for 2020 gives a result of 15.81C and to the extremes from my WS 15.75C. These are effectively identical to WS value given above.
- Note that for the BoM series I used my WS values for the 9 days in January 2020 when the BoM site was hors de feu but I don't believe this had any impact of outcome.

The average minimum temperature for 2020 at my WS was 11.9C: the BoM does not offer an annual mean minimum, possibly due to missing 9 days in January (but the equivalent data is not available for other sites) well above the series average of 10.9C.
The average maximum temperature for the year, at my WS was 20.7C. While the BoM has again not offered an annual maximum I have kept records through the year giving an approximate annual average value of 19.62 C. This is within 0.01C of the mean annual average maximum! (It is normal for the BoM station to have lower maxima than my station as the BoM site is far more exposed to cooling sea breezes.)
In both series the trend is upwards although the level of significance is not great.

 A caveat should be issued that my WS did not become operational until mid February in 2019 and thus the data is not absolutely comparably. However a comparison of my data for January 2020 with the rest of that year shows only slight differences (overall average -0.5%rH). Looking at BoM data for monthly averages suggests a relatively high reading for 0900 hrs in January 2019 and a relatively low reading for 1500 hrs.

Humidity
It is difficult to add much to that shown in my report for December, as BoM offers very scant historical information. A chart of average rH at my WS through the year shows slightly higher values for 2020 than 2019.

Overall I conclude that 2020 was slightly more humid than 2019. This is hardly surprising given that rainfall in 2020 was close to double that of 2019.
Wind
This is a risky topic as (a) BoM present surprisingly little wind data beyond daily readings and (b) my WS is not situated ideally for measuring wind with various obstructions from NE to SW - going clockwise. However I have found that the daily observations for direction are generally close to those from the airport and the measures of speed correlate well, so I conclude that while not absolutely reliable the data is fit for generalised statements.
Wind speed
Of the measures available from my WS I prefer using windrun and hourly gust. Rather than showing the monthly data covered in earlier reports I have charted the average run and peak gust through the day for the two years for which I have data. (The lack of data from the first 6 weeks of 2019 appears unlikely to significantly alter the comparison.)

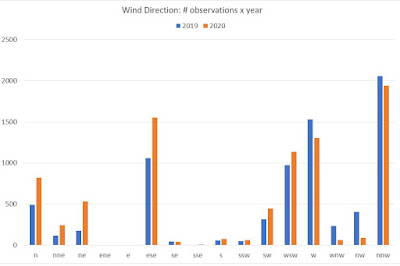
Wind direction
The pattern is again quite similar between the years. The higher number of observations from ESE in 2020 may reflect the passage of several East Coast Lows in that year.
 Contrasting the direction of the wind at the hourly point in time with the direction of the strongest gust is somewhat interesting with the gusts being recorded from all directions but with less records from the N and ESE.


No comments:
Post a Comment
Comments are welcome but if I decide they are spam or otherwise inappropriate they will not be approved.