Tuesday, 20 December 2022

Walking Captains Creek and related Tracks

 We have been doing a little training for some longer walks.  (Those with a long memory will remember a similar plan (possibly a Cunning Plan) in the past.  One of the longer walks we had in mind was a car shuffle from the Captains Creek Fire Trail to Bucklands.  For some reason we had this pegged as 12 km: in fact it was only 9km, which was a pleasant surprise as we worked it out.

I did three ebird checklists along the way, so have three maps covering the various stages of the walk.  This first one starts at Genoa Rd and goes down the fire trail to Captain's Creek Jetty.

This is looking back down the very steep section after 0.5 km.  Given the amount of rain we have had this year  the rebuilt track is holding up very well.
There is a bit more erosion  on the far side of the hill.
In this part of the walk the main vegetative interest was seed pods - these are Acacia suavolens.  There will not be a lack of regrowth when another fire goes through here.
There were a few chewed-up areas on the track, of which this was probably the worst.
More seed pods: I am pretty sure these are Dodonea triquetra.
A lone flower of Kennedia rubicunda.  This species isn't as common this year as last, and is probably less evident inland than on the coast.
We saw more trigger plants (Stylidium graminifolium) than we have noticed recently.
This is clearly a Leptospermum, and I would have expected it to be called something like L. ericifolium.  However I think it is actually L. continentale - which does seem to have been a rename from, or at least confused with, L. juniperinum.
Dampiera stricta: always a pretty plant.
Did I mention the amount of rain we have had?   It was rather surprising that this was the only set of puddles we cam across.
We didn't actually go to the Jetty but continued on towards Bucklands.
There were a few daisies around, but I haven't been able to identify them to species so far.
This section was somewhat interesting last time we did the walk, as the bridges had been burnt out and we had to use fallen trees to cross the watercourses.  Although the bridges have been replaced the back-ups are still in place.
Looking downstream.
Another side-creek, with nice reflections.
Fungus on a tree.
We only saw one orchid (Dipodium sp.) in the whole walk!
A large (for this area) Wahlenbergia sp.
The walking track is a lot narrower than the fire trail.
A gully with tree ferns.
A view across the mouth of Captains Creek to the repainted Jetty.
A new taxon: Exocarpos cupressiformis akwesane.  The subspecies name being that of a Mohawk Reservation spanning the border between New York State, Ontario and Quebec
The third leg was along the banks of the Narrows.
This was the first stretch where we found Bursaria spinosa (Blackthorn - grab a branch to verify the vernacular name).
A subsequent very tall shrub of the same species.
Melaleuca armillaris.
 A view of the Narrows.
Clematis aristata - most specimens, of which there were a lot, have gone to seed looking like Old Man's Beard.
We felt surprisingly spritely at the end of the walk.


Thursday, 15 December 2022

Sea Watching

 This is usually a term employed to describe sitting on land looking out at seabirds that have come into shore.  That is what I had hoped to be doing today, but in the near complete absence of birds of any description I took photos of the sea instead.

The first two are of Mummy Rock from Geology Point.


After 15 minutes during which I saw 1 Sooty Oystercatcher and no other birds I decided to relocate to Bastion Point where I could sit in my car and look at the sea.  I began from on top of the cliff,


Some of the waves were pretty large!

I then went down to the launching area.  I didn't get in the way of any boats being launched!

I didn't need warning signs to suggest it wasn't sensible to go out on the breakwater.  The next three shots were taken on the path to the seat.


Wednesday, 14 December 2022

A visit to Haycock Point

 On our way to Merimbula yesterday we swung into Haycocks Road and went to the Beach.  The road was in average conditions apart from some well beyond average potholes as we turned off the bitumen.  The beach was brilliant.

Some patterened rocks behind the beach.
Peering over a rocky point at the end of the beach we also found it was the end of the track.
Frances recalled seeing a track off somewhere as she came through the picnic area and we soon found it when we both looked.  Its pretty cleared in this snip from eBird track.
When we got to the end of the track the Cormorants (Great and Black-faced) were lined up like the Zulus at Rourke's Drift.
The ledge they are sitting on is on the RHS of the rocky knob.
I am currently re-reading Patricia Wrightson's Nargun series. much of the action of which is  actually set between about here and about Bemm River.  Pick your Nargun from this lot (remembering that the oldest Nargun is less than hand-sized
2 Sooty Oystercatchers on the side of the knob
An Eastern Reef Egret picks its Nargun.
An Old Man Banksia (B. serrata) covers the ground.
A sign of the times.  They did have a good supply left.


Monday, 5 December 2022


As the weather is warming up I thought I would investigate heat waves recorded in my data for Mallacoota.  These data include BoM data for Mallacoota, at the station near the Airport, from 1993 until January 2019 and data from my Weather Station (WS) since then.  


I have found that my WS records somewhat higher daily maximum temperatures than the BoM site, most likely due to the greater exposure  of the BoM site to cooling sea breezes, so used regression analysis to calculate adjustment factors.  My expectation is that the two series are now consistent.

Definition of a Heat Wave

The BoM Glossary defines heat wave as “A period of abnormally hot weather lasting several days.”.  They a more specific in their knowledge centre which defines a heat wave as “A heatwave occurs when the maximum and the minimum temperatures are unusually hot over a three-day period at a location.”


I have restricted my investigation to the 5 warmer months, November through March.  


The more specific definition seemed to require quite a lot of calculation to assess over the in-scope 4314 days so I simplified the definition to begin my investigations to make it “a period of three consecutive days of significantly above the long term average temperature for a month”.  I have defined significance as being 1 Standard Deviation (SD) greater than the mean.


After completing the work only using Maxima I made a second foray incorporating Minima into the process.  That seemed to work quite well so this report covers both.  I shall refer to the two phenomena as “Hot Spell” when only using Maxima and “Very Hot Spell” when Minima are also incorporated.

Boundary values

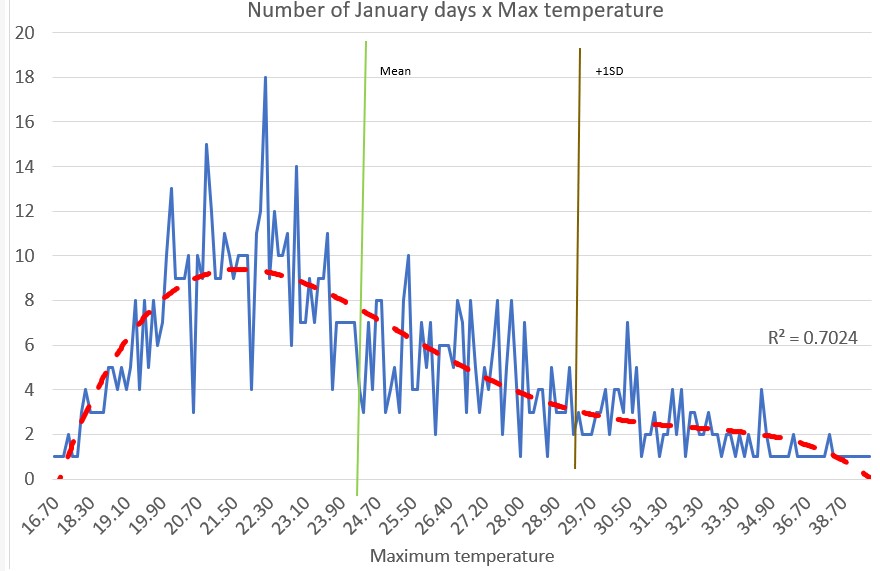
I calculated the average maximum temperature for each month, the SD of that average and 2 potential upper bounds, equivalent to (mean +1.96SD) and and (mean + 1 SD).  For this to work in a “pure” sense the distribution of maximum temperatures should be approximately normal: that isn’t the case as shown in the following example, using January data.


For my purposes I don’t think that matters as values to the right of the gold vertical line are clearly “significantly” greater than the average (ie mean, 24.5C).  (The median value is 23.7C while the mode lags back at 22.2C).  The table ‘Boundary Values Maxima’ in the Google Sheet “Heat Waves and Similar Phenomena “ sets out the actual values.

Hot Spells

Process

I used ACCESS to extract all the maximum temperatures for the relevant months and to compare the maxima with the boundary values for each month. I termed the values which exceeded the boundary value without considering the number of consecutive days as Potential Heat Wave Days.  They are shown in the appropriate table in the linked Google Sheet. 

I then extracted the records (date and maximum value) which exceeded the boundary value and clerically scanned the dates for strings of three or more consecutive days of high values.  I consider the dates which form these strings as Actual Hot Spell Days and the incidence of these x year is shown in the appropriate table in the linked Google Sheet.

In some cases the runs crossed a month limit: for example in 2021 December 30 and 31 exceeded the December boundary of 26.75C and in 2022 January 1 and 2 exceeded the January limit of 28.98C.  I have scored that as a run of 4: the alternative approach of requiring the December maxima to exceed the January boundary is perhaps ‘nicer’ but:

  1. The difficulties with the distribution of maxima probably result in far greater dodginess than this; and

  2. No sheep stations nor, more relevantly for Mallacoota, luxury holiday homes are riding on the outcome of this investigation.

So near enough will do.


The final step was to count up the number of ‘heat wave days’ (HWD) in each past month.  In this case a HWD is simply part of a string.  In the example discussed above the string which bridged the New Year counted 2 days in December 2021 and 2 days in January 2022.  This can result in a month having 1  HWD as part of a string and the rest of the month not being in a string: an example is in February 2020 where a three day string covers January 30 to February 1.

Outcome for Hot Spell Days

As noted above I have put the values for each month in 2 table in the linked Google Sheet.  An easy way to look at the outcome is through the following chart comparing Potential and Actual Hot Spell Days.

It is to be expected that the number of actual Hot Spell Days is less in every year than the number of potential days.  It is of interest - but I think to be expected from the process - that there are at least a few Potential days in every year.  It is not surprising that in some years there are no Hot Spells.


In neither series is the value of r2 such that I consider the trend significant.

Very Hot Spells

Process

In essence I followed the same process to identify the Boundary Values for Hot Minima (see table in the Google Sheet) a set of days with Minima above the boundary and to then match the days in that set which also had hot maxima.  This set was then searched for runs of 3 days or more.


A comparison between Hot Spell Days (maxima only) and Very Hot Spell Days (Maxima and Minima above average) is shown in this chart.

The addition of the criterion for minimum temperatures has caused a significant decrease on the number of Days caught by the process.  Again the value of r2 for the Very Hot series is not significant.

The impact of criteria

Overall I have examined data for 4314 days and identified 44 Very Hot Spell days.  To illustrate how the various criteria (Maxima and Minima over boundary levels and 3+ day runs) work to give this result I have created a tree diagram.


Saturday, 3 December 2022

Weather Report November 2022

An interesting month of weather.  While most of the country (not counting the sandy bit in the middle and the West) has been suffering floods, Mallacoota has been quite and cool, with a little wind at times.

Rainfall

Our recent experience has been for above median falls.  However for November the total fall at my Weather Station (WS) only amounted to 43.6 mm which is 69% of the median fall.  It was also well below November 2021.
I have continued my pro-rata estimation of the annual fall which is currently standing at 1,350mm  If that is achieved (requiring 105 mm in December) it would be the 4th highest fall since records began in 1975.  (To beat the record - 1442 mm in 1985 - would require 203 mm in December: not impossible but unlikely.) This chart shows the development of the estimate through the year: in essence high falls and a high multiplier in the first quarter have declined gradully through the rest of the year
Rain fell on several days but not in great quantities, apart from the 17mm on the 1st.  The falls were also not very heavy with the peak rate of 70mm/hr not setting any records!

Temperatures

The development of the anomaly, using BoM data, through the month suggests a cool start, followed by a warm spell and ending with further cooling.  The anomaly for the month as a whole was -0.63C, quite a strong negative value, with both minimum and maximum averages negative.
The extremes from my WS show the same pattern.
I have also plotted the November extreme temperatures over the entire data set. 
A linear trend line fitted to both series gives an appearance of an upwards slope, but the value of R2 for both series is quite modest so it is not appropriate to claim an upwards trend.

Minimum temperatures

The average minimum temperature from my WS exactly matched the average of the series since 1993.  It was a little below the value for 2021.

Maximum temperatures

The average maximum was 20.93C, well below average but above the same variable for 2021.  
With Summer approaching a cliché of interest is that of a heat wave.  The BoM defines that as 3 or more days of temperatures significantly above average. I have calculated, for each month the average maximum and the Standard Deviation (SD) of that series.   For November the value of average +1SD is (20.94 + 4.35) = 25.29C.  No day in November 2022 exceeded that value.  (I have separately investigated the number of heat wave days per month in the past and will compile a post on that topic in the near future.)

Humidity

The humidity readings for the month were unremarkable, possibly with morning (0900) values a little  lower than expected.  While the afternoon (1500hrs) values were mostly well below the morning ones, there were few readings below 50%.


Wind

As suggested in the preamble it was quite a windy month, with the wind run a little above the 4 year average for my WS.

The daily runs were reasonably modest apart from the period around 10 November.  The run of 494 km on the 10th was the 4th longest I have recorded here.

It seemed likely that this was due to the passage of a front.  The next chart shows the hourly wind run gradually increasing through the 9th and 10th with a reasonably stable barometric pressure, until midday on the 10th.  Then the wind drops away quite quickly as the pressure drops.  Later on the 11th both measures look to have stabilised.


Thursday, 1 December 2022

Whimbrels-R-Us

 On 29 November Rob Clay reported (and photographed) a Whimbrel from Captain Stevenson's Point at Mallacoota.  I was in Canberra then so couldn't get out there until this morning (1 December).  

On first getting to the Point the light didn't look that good for bird photography (nor, come to that, continued ocular health).

However on swinging my telescope around a few degrees to the NE I found not one, but two birds which I thought were Whimbrels and have subsequently been agreed to be that species.  The first two images are digiscoped while the third is cropped (pretty severely) from my camera.


In coming to the conclusion of the identification I bear in mind a comment - in about 1985 - by the late Stephen Marchant when asked if Whimbrels were like Curlews.  His response was along the lines of "Dear boy, they're completely different."  To him that was probably the case, but for mortals the obvious difference is the length of the bill: Rob Clay addressed this by saying that for the Eastern Curlew the bill is about the length of the bird's back while the Whimbrel is much shorter.  To reinforce this I have extracted some details on bill lengths from HANZAB (omitting some extreme cases these seems a fair summary).
Note that there is almost no overlap between the 4 groups.  To explore the relativities to length of back I have looked at the ratio of length of bill (taking an average for each species) to overall length (at the start of the HANZAB species accounts.  
Clearly the bill of a Whimbrel is not only shorter in absolute terms but also relative to the body size.  (A relative difference is still evident, but not quite so pronounced,  if comparing a female Whimbrel with a male Curlew.)
 
I have interrogated my set of eBird records to see how unusual this is.  ( I have over the years we have been coming here spent quite a few unsuccessful hours peering at various largeish brownish waders hoping for a Whimbrel.  They have just about been awarded "Painted" status: Ian Fraser has commented that any bird with 'Painted' in its vernacular name is a pigment of the observers imagination.  However eBird has 33 records of this species.  Looking at occurrence over the years in the Mallacoota District gives the next chart.
For the years since 2014 - when eBird became the recording process of choice - there is usually 1 or 2 records per year.  2018 is unusual with no records.  2014 is also unusual with 7 records and as they are in different months spread through the year I conclude that a young bird over-wintered here that year.

On the subject of seasonality the species is clearly a Summer Migrant.
The lack of records from the suggested overwintering bird in June to August simply reflects the seasonal pattern of tourists: they're wimps who don't come here in Winter.

I also looked at eBird records for East Gippsland.  This amounted to 49 birds.  Given that the coastline of my version of Mallacoota District (Wingan to the Border) is roughly 20% of the total straight-line length of the sea length in East Gippsland in total that is a very interesting outcome.  If one adds the many kilometres of shoreline in the Gippsland Lakes it is even more intriguing.